Nasdaq Financial Data Analysis
Python analysis of Accrued Expenses Turnover in a Nasdaq Data Link dataset, comparing companies and countries from 2010 to 2015.
Project library
Read the original notebook, including its code, tables and saved charts. No account is required.
Exploring Financial Data with the Nasdaq Data Link API
Introduction
This project explores financial data retrieved from the Nasdaq Data Link API using Python. The analysis focuses on the Accrued Expenses Turnover financial metric and examines how this metric changes over time for different companies.
The main objectives are to retrieve financial data through an API, transform the JSON response into a Pandas DataFrame, clean and filter the dataset, analyze financial trends from 2010 to 2015, compare results across geographical regions, and visualize the findings using Matplotlib.
import requests
import pandas as pd
import matplotlib.pyplot as plt

from google.colab import userdata

api_key = userdata.get('NASDAQ_API_KEY')

print("Libraries imported and API key loaded successfully.")Libraries imported and API key loaded successfully.
Nasdaq Data Link API
For this project, the financial data is retrieved from the MER/F1 table using the Nasdaq Data Link Tables API.
The API allows parameters to filter rows, select specific columns, and control the number of results returned. For this first request, only 10 rows will be retrieved so that the JSON response can be inspected easily.
Authenticated users have higher API usage limits than anonymous users, so the API key is included with each request.
api_url = "https://data.nasdaq.com/api/v3/datatables/MER/F1.json"

params = {
    "api_key": api_key,
    "qopts.per_page": 10
}

response = requests.get(api_url, params=params)

print("Status code:", response.status_code)

json_data = response.json()

print("Rows returned:", len(json_data["datatable"]["data"]))
print("Columns returned:", len(json_data["datatable"]["columns"]))

print("\nColumn names:")
print([column["name"] for column in json_data["datatable"]["columns"]])

print("\nFirst row:")
print(json_data["datatable"]["data"][0])Status code: 200 Rows returned: 10 Columns returned: 32 Column names: ['compnumber', 'reportid', 'mapcode', 'amount', 'reportdate', 'reporttype', 'auditorstatus', 'currency', 'consolidated', 'longname', 'shortname', 'status', 'countrycode', 'region', 'cik', 'mic', 'ticker', 'exchange', 'address1', 'address2', 'address3', 'address4', 'city', 'statecode', 'country', 'zipcode', 'phonenumber', 'faxnumber', 'website', 'fye', 'indicator', 'statement'] First row: [2438, 1868192544, -1802, 10.481948, '2011-06-30', 'Q2', 'U', 'EUR', 'True', 'Deutsche Bank AG', 'Deutsche Bank AG', 'Active', 'DEU', 'Europe', 1159508, '5.1.1', 'DB', 'NYS', 'Taunusanlage 12', None, None, None, 'Frankfurt am Main', None, 'DEU', '60325', '(49) 69 910 00', '(49) 69 910 34 225', 'www.db.com', '2025-12-31', 'Accrued Expenses Turnover', 'Derived']
Processing the JSON Data
The API response contains the financial data inside the data section and the corresponding column information inside the columns section.
To make the dataset easier to analyze, the JSON response will be converted into a Pandas DataFrame.
params["qopts.per_page"] = 10000

response = requests.get(api_url, params=params)
json_data = response.json()

data = json_data["datatable"]["data"]

columns = [
    column["name"]
    for column in json_data["datatable"]["columns"]
]

df_metric = pd.DataFrame(data, columns=columns)

df_metric.head()| compnumber | reportid | mapcode | amount | reportdate | reporttype | auditorstatus | currency | consolidated | longname | ... | city | statecode | country | zipcode | phonenumber | faxnumber | website | fye | indicator | statement | |
|---|---|---|---|---|---|---|---|---|---|---|---|---|---|---|---|---|---|---|---|---|---|
| 0 | 2438 | 1868192544 | -1802 | 10.481948 | 2011-06-30 | Q2 | U | EUR | True | Deutsche Bank AG | ... | Frankfurt am Main | None | DEU | 60325 | (49) 69 910 00 | (49) 69 910 34 225 | www.db.com | 2025-12-31 | Accrued Expenses Turnover | Derived |
| 1 | 2438 | 1868216112 | -1802 | 8.161754 | 2011-09-30 | Q3 | U | EUR | True | Deutsche Bank AG | ... | Frankfurt am Main | None | DEU | 60325 | (49) 69 910 00 | (49) 69 910 34 225 | www.db.com | 2025-12-31 | Accrued Expenses Turnover | Derived |
| 2 | 2438 | 1885063456 | -1802 | 10.788213 | 2012-06-30 | Q2 | U | EUR | True | Deutsche Bank AG | ... | Frankfurt am Main | None | DEU | 60325 | (49) 69 910 00 | (49) 69 910 34 225 | www.db.com | 2025-12-31 | Accrued Expenses Turnover | Derived |
| 3 | 2438 | 1885087024 | -1802 | 9.437545 | 2012-09-30 | Q3 | U | EUR | True | Deutsche Bank AG | ... | Frankfurt am Main | None | DEU | 60325 | (49) 69 910 00 | (49) 69 910 34 225 | www.db.com | 2025-12-31 | Accrued Expenses Turnover | Derived |
| 4 | 2438 | 1901934112 | -1802 | 8.755041 | 2013-06-30 | Q2 | U | EUR | True | Deutsche Bank AG | ... | Frankfurt am Main | None | DEU | 60325 | (49) 69 910 00 | (49) 69 910 34 225 | www.db.com | 2025-12-31 | Accrued Expenses Turnover | Derived |
5 rows × 32 columns
Understanding the Dataset
Before starting the analysis, it is useful to inspect the structure of the DataFrame and identify the columns that are relevant for the project.
The main columns needed are:
indicator: identifies the financial metric.country: identifies the country of the company.longname: contains the company name.reportdate: contains the reporting date.reporttype: identifies the type of financial report.amount: contains the value of the financial metric.
These columns are important because they allow us to compare companies, analyze changes over time, and compare results between countries.
print("DataFrame shape:", df_metric.shape)

df_metric.info()DataFrame shape: (10000, 32) <class 'pandas.core.frame.DataFrame'> RangeIndex: 10000 entries, 0 to 9999 Data columns (total 32 columns): # Column Non-Null Count Dtype --- ------ -------------- ----- 0 compnumber 10000 non-null int64 1 reportid 10000 non-null int64 2 mapcode 10000 non-null int64 3 amount 10000 non-null float64 4 reportdate 10000 non-null object 5 reporttype 10000 non-null object 6 auditorstatus 9999 non-null object 7 currency 10000 non-null object 8 consolidated 10000 non-null object 9 longname 10000 non-null object 10 shortname 10000 non-null object 11 status 10000 non-null object 12 countrycode 10000 non-null object 13 region 10000 non-null object 14 cik 10000 non-null int64 15 mic 10000 non-null object 16 ticker 9380 non-null object 17 exchange 10000 non-null object 18 address1 10000 non-null object 19 address2 6001 non-null object 20 address3 1298 non-null object 21 address4 0 non-null object 22 city 8432 non-null object 23 statecode 5813 non-null object 24 country 10000 non-null object 25 zipcode 9068 non-null object 26 phonenumber 10000 non-null object 27 faxnumber 3681 non-null object 28 website 10000 non-null object 29 fye 10000 non-null object 30 indicator 10000 non-null object 31 statement 10000 non-null object dtypes: float64(1), int64(4), object(27) memory usage: 2.4+ MB
necessary_columns = [
    "indicator",
    "country",
    "longname",
    "reportdate",
    "reporttype",
    "amount"
]

necessary_columns['indicator', 'country', 'longname', 'reportdate', 'reporttype', 'amount']
Filtering the Data
The dataset contains many different financial indicators. Since this project focuses on Accrued Expenses Turnover, the DataFrame will be filtered to keep only the relevant columns and rows for this specific metric.
filtered_df = df_metric[necessary_columns].copy()

filtered_df = filtered_df[
    filtered_df["indicator"] == "Accrued Expenses Turnover"
]

filtered_df.head()| indicator | country | longname | reportdate | reporttype | amount | |
|---|---|---|---|---|---|---|
| 0 | Accrued Expenses Turnover | DEU | Deutsche Bank AG | 2011-06-30 | Q2 | 10.481948 |
| 1 | Accrued Expenses Turnover | DEU | Deutsche Bank AG | 2011-09-30 | Q3 | 8.161754 |
| 2 | Accrued Expenses Turnover | DEU | Deutsche Bank AG | 2012-06-30 | Q2 | 10.788213 |
| 3 | Accrued Expenses Turnover | DEU | Deutsche Bank AG | 2012-09-30 | Q3 | 9.437545 |
| 4 | Accrued Expenses Turnover | DEU | Deutsche Bank AG | 2013-06-30 | Q2 | 8.755041 |
filtered_df["amount"].describe()| amount | |
|---|---|
| count | 139.000000 |
| mean | 26.908762 |
| std | 33.097291 |
| min | 4.689773 |
| 25% | 9.675670 |
| 50% | 13.753753 |
| 75% | 31.777614 |
| max | 229.810427 |
dtype: float64
Statistical Observation
The average Accrued Expenses Turnover is approximately 26.91, while the median is around 13.75. The values range from 4.69 to 229.81, with a standard deviation of approximately 33.10.
The large difference between the median and the maximum value suggests that some companies have much higher turnover values than others. This explains the relatively high variability in the dataset.
Enhancing the DataFrame
To make the dataset easier to read, the country codes will be converted into full country names. The longname column will also be renamed to company_name, and the column names will use a consistent naming style.
country_mapping = {
    "USA": "United States of America",
    "DEU": "Germany",
    "JPN": "Japan",
    "CYM": "Cayman Islands",
    "BHS": "Bahamas",
    "IRL": "Ireland",
    "GBR": "United Kingdom"
}

def get_country_name(country):
return country_mapping.get(country, country)updated_df = filtered_df.copy()
updated_df["country_name"] = updated_df["country"].apply(get_country_name)
updated_df = updated_df.rename(columns={
"longname": "company_name",
"reportdate": "report_date",
"reporttype": "report_type"
})
updated_df.head()| indicator | country | company_name | report_date | report_type | amount | country_name | |
|---|---|---|---|---|---|---|---|
| 0 | Accrued Expenses Turnover | DEU | Deutsche Bank AG | 2011-06-30 | Q2 | 10.481948 | Germany |
| 1 | Accrued Expenses Turnover | DEU | Deutsche Bank AG | 2011-09-30 | Q3 | 8.161754 | Germany |
| 2 | Accrued Expenses Turnover | DEU | Deutsche Bank AG | 2012-06-30 | Q2 | 10.788213 | Germany |
| 3 | Accrued Expenses Turnover | DEU | Deutsche Bank AG | 2012-09-30 | Q3 | 9.437545 | Germany |
| 4 | Accrued Expenses Turnover | DEU | Deutsche Bank AG | 2013-06-30 | Q2 | 8.755041 | Germany |
updated_df["country_name"].value_counts()| count | |
|---|---|
| country_name | |
| United States of America | 31 |
| Japan | 27 |
| Cayman Islands | 27 |
| Ireland | 25 |
| Bahamas | 19 |
| Germany | 6 |
| United Kingdom | 4 |
dtype: int64
Financial Trends Over Time
To analyze how Accrued Expenses Turnover changes over time, the data will be restricted to the period from 2010 to 2015.
The analysis will focus on the company name, report date, and financial amount.
updated_df["report_date"] = pd.to_datetime(updated_df["report_date"])

updated_df = updated_df[
    (updated_df["report_date"].dt.year >= 2010) &
    (updated_df["report_date"].dt.year <= 2015)
]

updated_df.head()| indicator | country | company_name | report_date | report_type | amount | country_name | |
|---|---|---|---|---|---|---|---|
| 0 | Accrued Expenses Turnover | DEU | Deutsche Bank AG | 2011-06-30 | Q2 | 10.481948 | Germany |
| 1 | Accrued Expenses Turnover | DEU | Deutsche Bank AG | 2011-09-30 | Q3 | 8.161754 | Germany |
| 2 | Accrued Expenses Turnover | DEU | Deutsche Bank AG | 2012-06-30 | Q2 | 10.788213 | Germany |
| 3 | Accrued Expenses Turnover | DEU | Deutsche Bank AG | 2012-09-30 | Q3 | 9.437545 | Germany |
| 4 | Accrued Expenses Turnover | DEU | Deutsche Bank AG | 2013-06-30 | Q2 | 8.755041 | Germany |
relevant_data = updated_df[
    ["company_name", "report_date", "amount"]
].copy()

relevant_data.head()| company_name | report_date | amount | |
|---|---|---|---|
| 0 | Deutsche Bank AG | 2011-06-30 | 10.481948 |
| 1 | Deutsche Bank AG | 2011-09-30 | 8.161754 |
| 2 | Deutsche Bank AG | 2012-06-30 | 10.788213 |
| 3 | Deutsche Bank AG | 2012-09-30 | 9.437545 |
| 4 | Deutsche Bank AG | 2013-06-30 | 8.755041 |
plt.figure(figsize=(12, 6))

for company in relevant_data["company_name"].unique():
    company_data = relevant_data[
        relevant_data["company_name"] == company
    ].sort_values("report_date")

    plt.plot(
        company_data["report_date"],
        company_data["amount"],
        label=company
    )

plt.title("Accrued Expenses Turnover by Company (2010–2015)")
plt.xlabel("Report Date")
plt.ylabel("Accrued Expenses Turnover")

plt.legend(
    title="Company",
    bbox_to_anchor=(1.05, 1),
    loc="upper left"
)

plt.tight_layout()
plt.show()
Trend Observation
The chart shows that Accrued Expenses Turnover varies considerably between companies during the 2010–2015 period.
Some companies show relatively stable values, while others have larger increases or decreases over time. This suggests that companies manage their accrued expenses differently.
Geographical Region Analysis
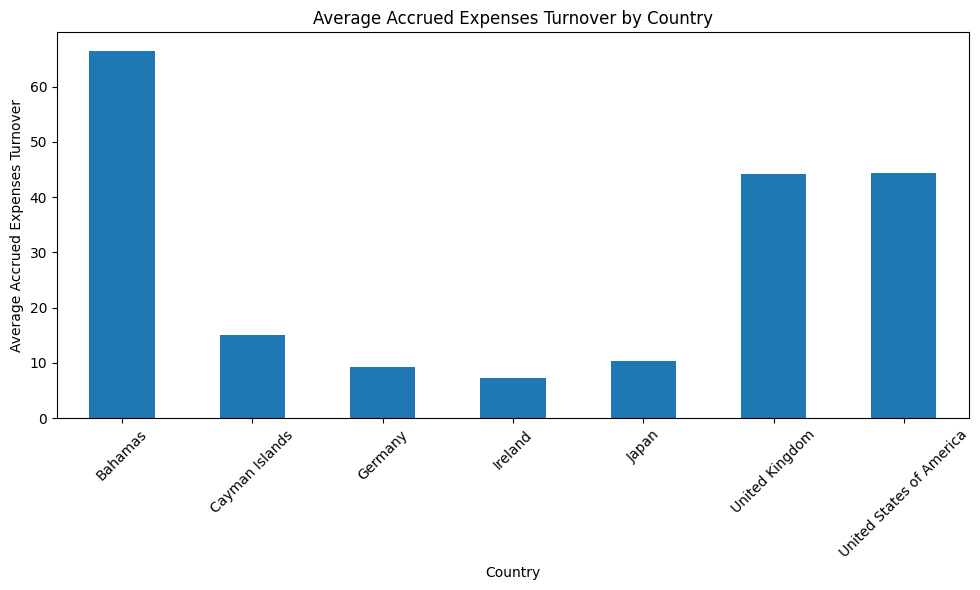
The data can also be grouped by country to compare the average Accrued Expenses Turnover across different geographical regions.
For this analysis, the average amount will be calculated for each country.
country_avg = updated_df.groupby("country_name")["amount"].mean()

country_avg| amount | |
|---|---|
| country_name | |
| Bahamas | 66.515369 |
| Cayman Islands | 15.060796 |
| Germany | 9.288999 |
| Ireland | 7.264400 |
| Japan | 10.376605 |
| United Kingdom | 44.166750 |
| United States of America | 44.377585 |
dtype: float64
plt.figure(figsize=(10, 6))

country_avg.plot(kind="bar")

plt.title("Average Accrued Expenses Turnover by Country")
plt.xlabel("Country")
plt.ylabel("Average Accrued Expenses Turnover")

plt.xticks(rotation=45)
plt.tight_layout()
plt.show()
country_avg| amount | |
|---|---|
| country_name | |
| Bahamas | 66.515369 |
| Cayman Islands | 15.060796 |
| Germany | 9.288999 |
| Ireland | 7.264400 |
| Japan | 10.376605 |
| United Kingdom | 44.166750 |
| United States of America | 44.377585 |
dtype: float64
Conclusion
In this project, financial data was retrieved from the Nasdaq Data Link API and converted into a Pandas DataFrame for analysis.
The analysis focused on Accrued Expenses Turnover. The data showed considerable differences between companies and countries. During the 2010–2015 period, some companies had relatively stable values, while others showed larger changes over time.
When comparing countries, the Bahamas had the highest average Accrued Expenses Turnover in this dataset, at approximately 66.52. The United States and the United Kingdom also had relatively high averages, at approximately 44.38 and 44.17 respectively.
These results show how Python, Pandas, and Matplotlib can be used together to retrieve, clean, analyze, and visualize financial data from an API.
Project report
Read the full report here, or open the PDF in a separate tab.